Wish to be the next Sherlock Holmes? Check RelationLine!
Finding clues from a small piece of data is no longer an arduous task; however, when facing real-world problems, there is often more than one source of data available. When the clues lie in front of you, how are you able to deduct the truth from them?
Recently, Alibaba-Zhejiang University Joint Research Institute of Frontier Technologies (AZFT) has published their latest research, which is called RelationLine. RelationLine is a visual analysis system that is capable of inferring individual relationship networks from heterogeneous data of a city.
Different city data provide different clues for the construction of personal relationship networks. For example, the distribution information of functional areas can be used to infer the motives of people visiting specific locations; data from social media provide descriptions of past events; track data reveal different concomitant relationships.
Concomitant relationship refers to the situation that two or more individuals stay in the same place at the same time or have the same track data. Different interpretations of this type of relationship will be made according to different individuals, times and locations. For example, the short-term companionship between a man and a car may simply suggest that the person is a passenger. However, if such companionship lasts long, the man is very likely to be a driver.
Identifying concomitant relationships from track data has great value in application, which too is very challenging. It is difficult to relate track data to other data due to different source and precision. In addition, these concomitant relationships may lead to multiple meanings, which also burdens interpretation.
In response to the two major challenges, CHENG Wei and his team from the State Key Laboratory of Computer Aided Design and Graphics of ZJU, have been working with Alibaba Cloud City Brain Team onthe visual analysis system – RelationLine.
First problem: track matching
For the first challenge, the concomitant relations obtained from track data gives a quadtree-based method in matching track data.
First, points on the map will be encoded into a long string of numbers through quadtree. In the process of matching, the user can adjust matching accuracy by setting the number of matching bits so as to meet the matching needs regarding different data and analysis. Next, depending on the type of data, RelationLine provides two ways to calculate the similarities among track data.
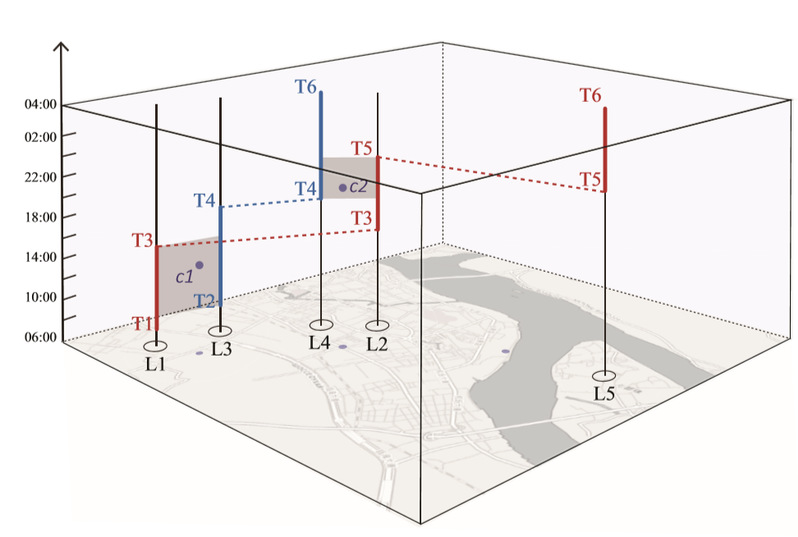
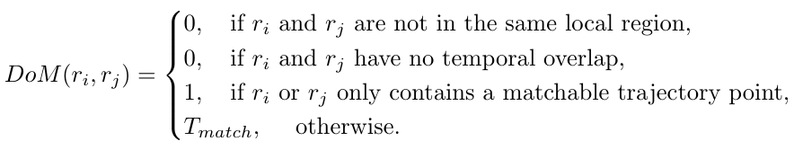
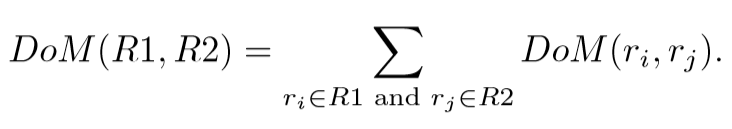
For things like checking in and punching the clock, RelationLine will count the number of track points that match. For a more complete set of track data, RelationLine calculates the sum of the matching duration of each track r (see Figure 1 and the following formula). In this way, data of different formats and precision will be matched with each other.
Second problem: concomitant relations
As mentioned, the second challenge lies in interpreting concomitant relationships. The study was able to produce a set of specific analysis methods. Below is an example of a taxi.
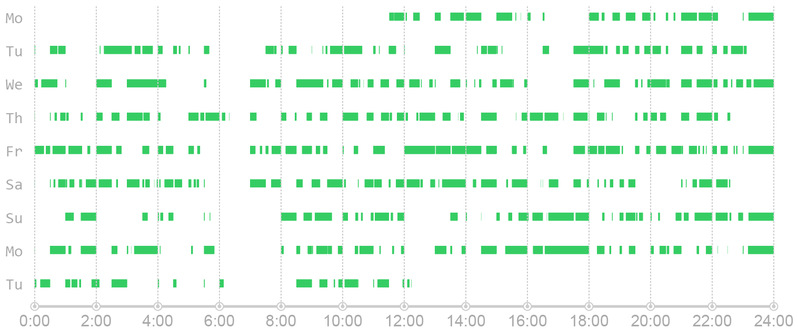
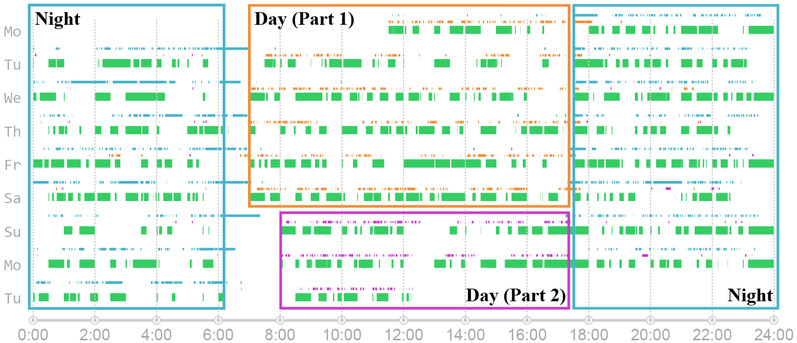
Firstly, the user needs to select an object from the database. In this case, a taxi that works day and night is chosen (the green blocks in Figure 2 suggesting there’re passengers on the taxi during the corresponding time). From the distribution of green blocks, it can be concluded that this taxi has more than one driver, who works alternately.
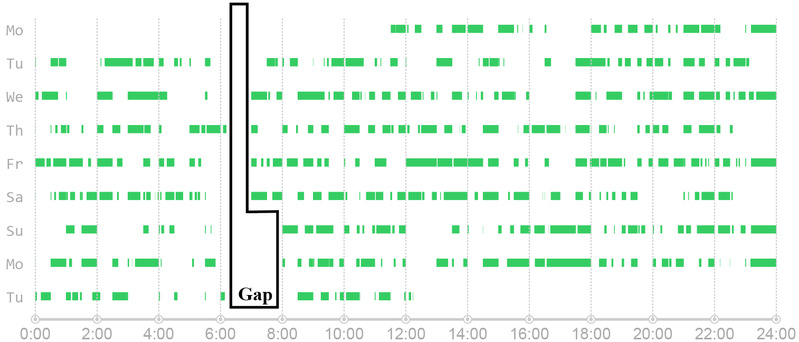
In order to find out the pattern of changing shifts, you need to find the corresponding driver by exploring tracks recorded by the taxi and by mobile base stations. From the distribution of green blocks, it’s observed that around 7:00 am no driver is taking orders. It can be speculated that 7:00 am is where the shift occurs (see Figure 3).
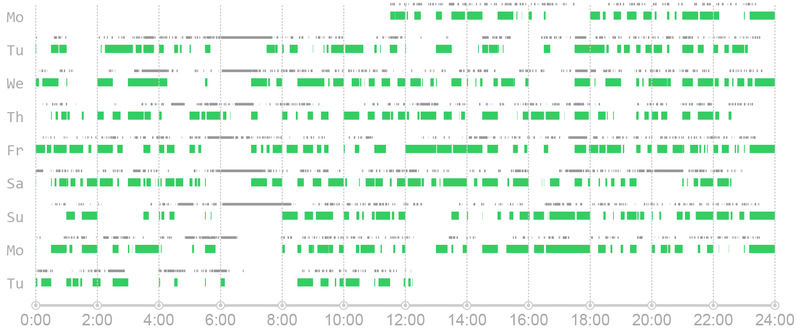
Therefore, data segments on the left side (night shift driver) and on the right side (day shift driver) of the gap will be used respectively for matching. The track found that matches the most (marked as a gray line above the green block in Figure 4) is inferred to be the GPS device installed onto the taxi that navigates the drivers.
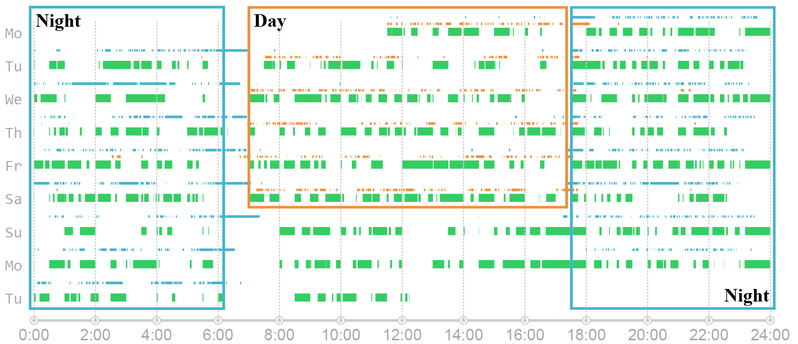
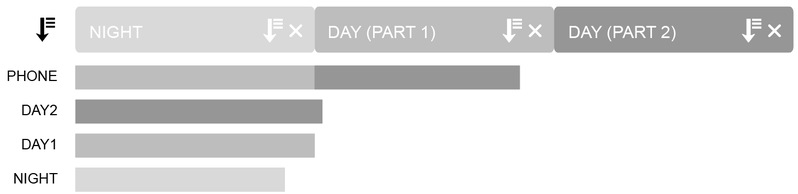
Next, two drivers of the taxi are found. The matching parts of the two drivers are marked in blue and orange boxes in Figure 5.
However, the day shift driver’s track data are only matched for the first six days. This leads to a third driver of the taxi (Figure 6). If you go on matching, the third driver will be found (marked in purple box in Figure 7).
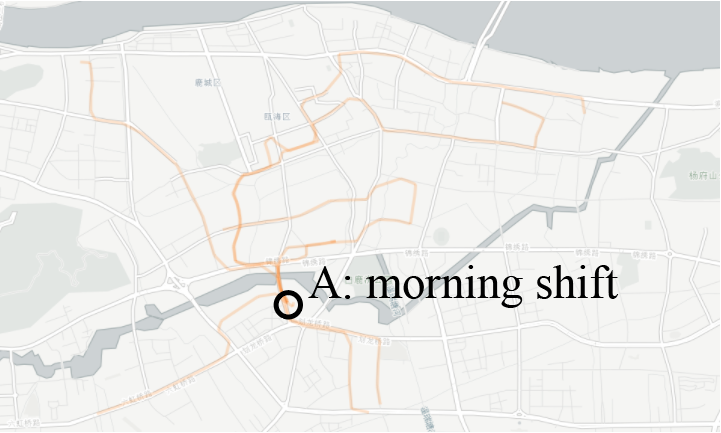
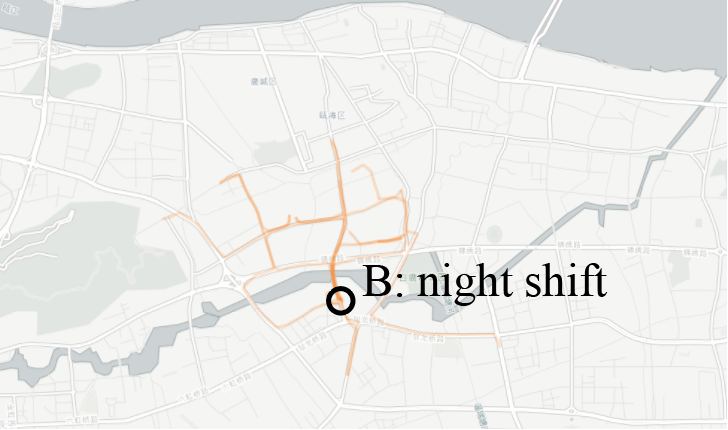
The last step is to analyze the behavior of passing on shifts between the drivers. When all the matched data are marked, two shift times are found: one at 7:00 am and another at 17:30 pm. By observing the track on the map, the locations for shift changing at the corresponding time can be pinpointed (Figure 8).
Currently, RelationLine can only carry out research on individual relationship network. There is no doubt that experience drawn from individual analysis will contribute to more complex group analysis in the future.
Source: College of Computer Science and Technology